Created on:
December 10, 2024
5.0
153
13
Introducing the BIM Deviation Analyzer
In the construction industry, it’s very important to make sure that the actual building matches the planned design. We are excited to introduce our new web application, the BIM Deviation Analyzer. This tool helps users compare their construction models with point cloud data to find any differences. This presentation will explain how the BIM Deviation Analyzer works, its features, and the benefits it offers. It shows how this tool can improve accuracy, teamwork, and efficiency in your construction projects.

Features and Functionalities
1. Heat Map Generation

The BIM Deviation Analyzer offers heat maps, providing visual reports that highlight deviations between the Building Information Model (BIM) and the point cloud data. This feature allows users to quickly identify and analyze discrepancies, ensuring that the construction aligns with the planned design.
2. Cloud-Based Collaboration

Our application supports cloud-based collaboration, enabling teams to easily share and present deviation analysis results. This ensures that all stakeholders, including clients and team members, are on the same page, and it can also handle large datasets. The cloud-based nature of the application ensures accessibility and scalability, allowing for seamless integration into your workflow.
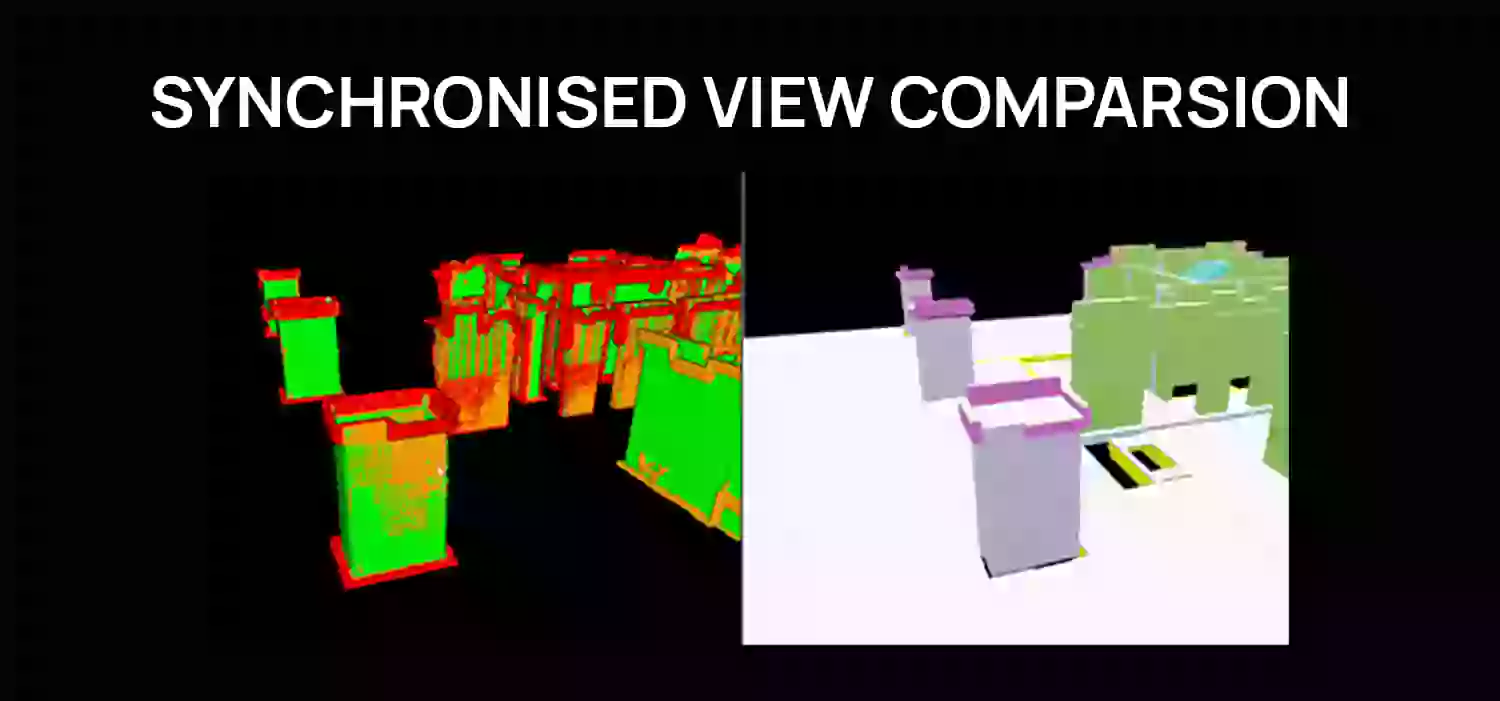
3. Synchronized View Comparison

The synchronized view comparison feature allows users to see deviation results alongside the actual model in a parallel view. By clicking on a specific element, users can examine both the original and deviated models side by side. This detailed, element-by-element comparison facilitates a deeper understanding of deviations at various levels of the building, enhancing accuracy in assessment and decision-making.
4. Graphical Representation

The BIM Deviation Analyzer also provides graphical representations of deviations. These bar graphs display deviations of different elements (columns, beams, walls, etc.) across various levels of the building. This feature enables users to quickly identify patterns and areas that require attention, streamlining the deviation analysis process.
5. Multiple Report Generation

In the BIM Deviation Analyzer, users can generate multiple reports with different deviation ranges. This flexibility allows for detailed analysis tailored to specific project needs, providing insights across various tolerance levels.
How It Works
Step 1: Upload Your IFC Model and Point Cloud
Begin by uploading your IFC (Industry Foundation Classes) model and the corresponding point cloud data. Ensure that both datasets share the same location coordinates for accurate analysis.
Step 2: Run Process
After uploading your data, click the ‘Analyze’ button. The BIM Deviation Analyzer will process the information, comparing the BIM model with the point cloud data.
Step 3: View Heat Map and Detailed Analysis
Once the analysis is complete, a heat map will be generated, visually highlighting deviations. Users can explore these deviations in detail through synchronized views and graphical representations.
Benefits
Enhanced Accuracy
The BIM Deviation Analyzer ensures precise deviation analysis, helping to identify and rectify discrepancies early in the construction process. This accuracy reduces the risk of costly rework and delays.
Improved Collaboration
With cloud-based collaboration, teams can easily share and discuss analysis results, enhancing communication and coordination among stakeholders. This feature supports effective project management and decision-making.
Time and Cost Efficiency
By quickly identifying and addressing deviations, the BIM Deviation Analyzer saves time and reduces costs associated with errors and rework. The graphical representation feature further streamlines the analysis process, providing clear insights at a glance.
Comprehensive Analysis
The combination of heat maps, synchronized views, and graphical representations offers a comprehensive analysis of deviations. Users can delve into specific elements and levels, ensuring a thorough understanding of discrepancies and their impacts.
Discover more of our innovative blogs

APPLICATION DEVELOPMENT
APPLICATION DEVELOPMENT
See the sun differently – RoL by Clove Tech

GEO BIM
GEO BIM
GeoBIM Insights: Transforming Construction and Infrastructure

SCAN TO BIM
SCAN TO BIM
MEP BIM Modeling: Better Accuracy, Fewer Errors, Stronger Outcomes

SCAN TO BIM
SCAN TO BIM
Revit and BIM: A New Era for Construction Efficiency
Let's Talk
Let’s discuss your requirements and see how our expertise can help on your next project.
Let's Get Started
Let's Get Started